7.9 3-D Plotting
The plotter can display vectors and line segments in 3 dimensions by projecting x-y-z coordinates onto 2 dimensions. Following the conventions in many mathematics textbooks, a right-hand coordinate system is used. The horizontal axis displays y values, the vertical axis displays z values, and a third axis extending "out" displays the x values.
Transition to the 3-dimensional view is performed automatically when 3-part coordinates are encountered, but it has an odd effect when the plotter already contains a 2-d plot. Because of the reassignment of axes, 2-d plots lie down onto the x-y plane.
7.9.1 Expression Types
The plotter handles the following types of expression in 3 dimensions.
- Vector
- A vector with three components is displayed as a position vector by drawing a line from the origin to the point defined by the vector.
- Radial
- A radial value with a magnitude and two angles is called a
spherical value ; it defines a point in 3 dimensions. A spherical value is displayed by converting is to a 3-component vector value and displaying it as a position vector. - Tuple of Vectors or Sphericals
- A tuple is displayed by drawing a line between the points defined by values in the tuple; spherical values are converted to vector values
- Set of Vectors or Sphericals
- A set is displayed by drawing each vector as a position vector; spherical values are converted to vector values
7.9.2 Adjusting the Plot
The third axis extends from the origin to bottom-left corner of the third quadrant. Although the third axis cannot be adjusted directly, it does react to changes in the scale and negative limits of the horizontal and vertical axes. Those values determine the aspect ratio of the third quadrant and thus determine the angle of the third axis. That angle in turn affects the projection.
7.9.3 Example
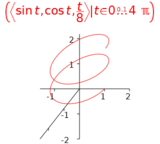
The plot in Figure §7.15 shows the expression